Los Angeles-metro payrolls, September 2026
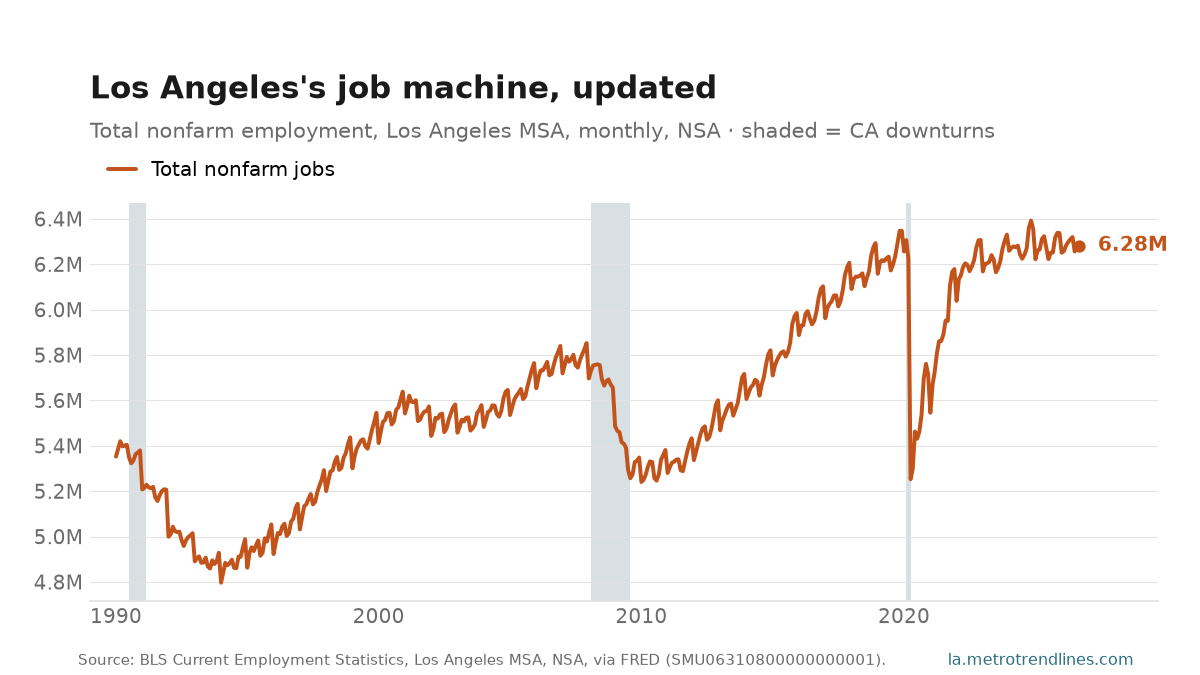
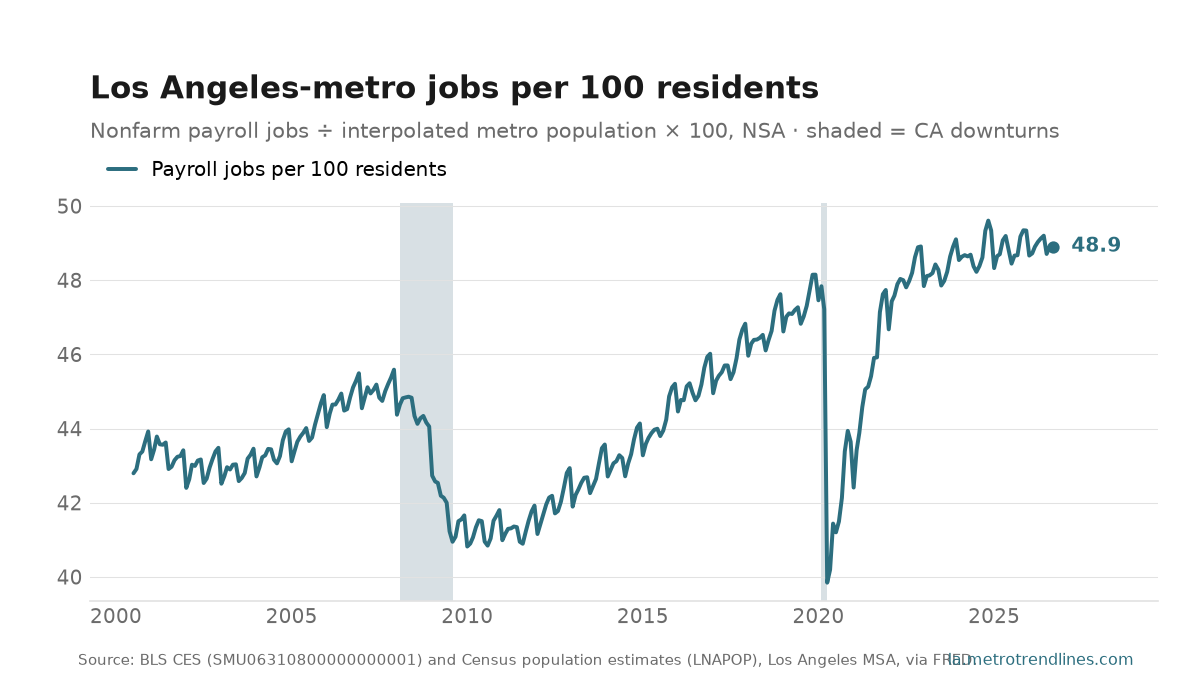
Los Angeles–Long Beach–Anaheim employers reported 6,282,100 nonfarm jobs in September 2026 (not seasonally adjusted), up 30,200 — +0.5% — from a year earlier. Set against everyone who lives in the metro, that is 48.9 payroll jobs for every 100 residents, against 48.7 a year before.
The second chart is there because a count of jobs always grows in a growing region. Jobs per resident does not have to: it peaked at 49.6 in November 2024, fell to 39.8 in April 2020, and says whether the job machine is keeping up with the people arriving to use it.
It is not the employment rate, and the difference matters. The official rate counts people with work, by where they live, as a share of adults. This counts jobs at employers in the metro — a second job counts twice, and someone commuting in from outside the metro counts here — divided by every resident, children and retirees included. So an ageing population pulls it down with no change in the job market. Read the direction, not the level.
The population is the Census Bureau’s July 1 estimate for the same two-county metro, interpolated between years; the chart starts in 2000 because that is where the annual estimates on FRED begin. Because payrolls aren’t seasonally adjusted, the year-over-year change is the one to watch.
Sources: U.S. Bureau of Labor Statistics, Current Employment Statistics, Los Angeles–Long Beach–Anaheim MSA, not seasonally adjusted, via FRED SMU06310800000000001; U.S. Census Bureau resident population estimates for the same MSA, via FRED LNAPOP, interpolated to monthly. The ratio is computed at read time. Auto-generated each build.